
Recent News
Returns and Credits: The Margin You’re Losing Stop by Stop
Introduction
It’s the first week of August. One of your drivers stands at a convenience store freezer, pulling out four boxes of novelties that expired last week. He writes it up, the store manager initials it, and the product goes back on the truck. Two stops later, he repeats the process with a different item.
Later that afternoon at the warehouse, someone signs off on the credits. No one questions it. It’s August. This is just how August goes.
That’s the part to notice—not the credit itself, but how normal it feels. Returns, credits, and buybacks aren’t tracked as a single line item. They’re scattered across driver paperwork, credit memos, and many small decisions at each stop, so they rarely get added up as one number.
But they do add up to a single number. In the middle of peak season, when volume is up and product moves faster, everyone is making quick decisions at the truck. That number grows, not shrinks. The same things that make summer your best revenue months also make it your leakiest.
The Four Places Return Losses Accumulate
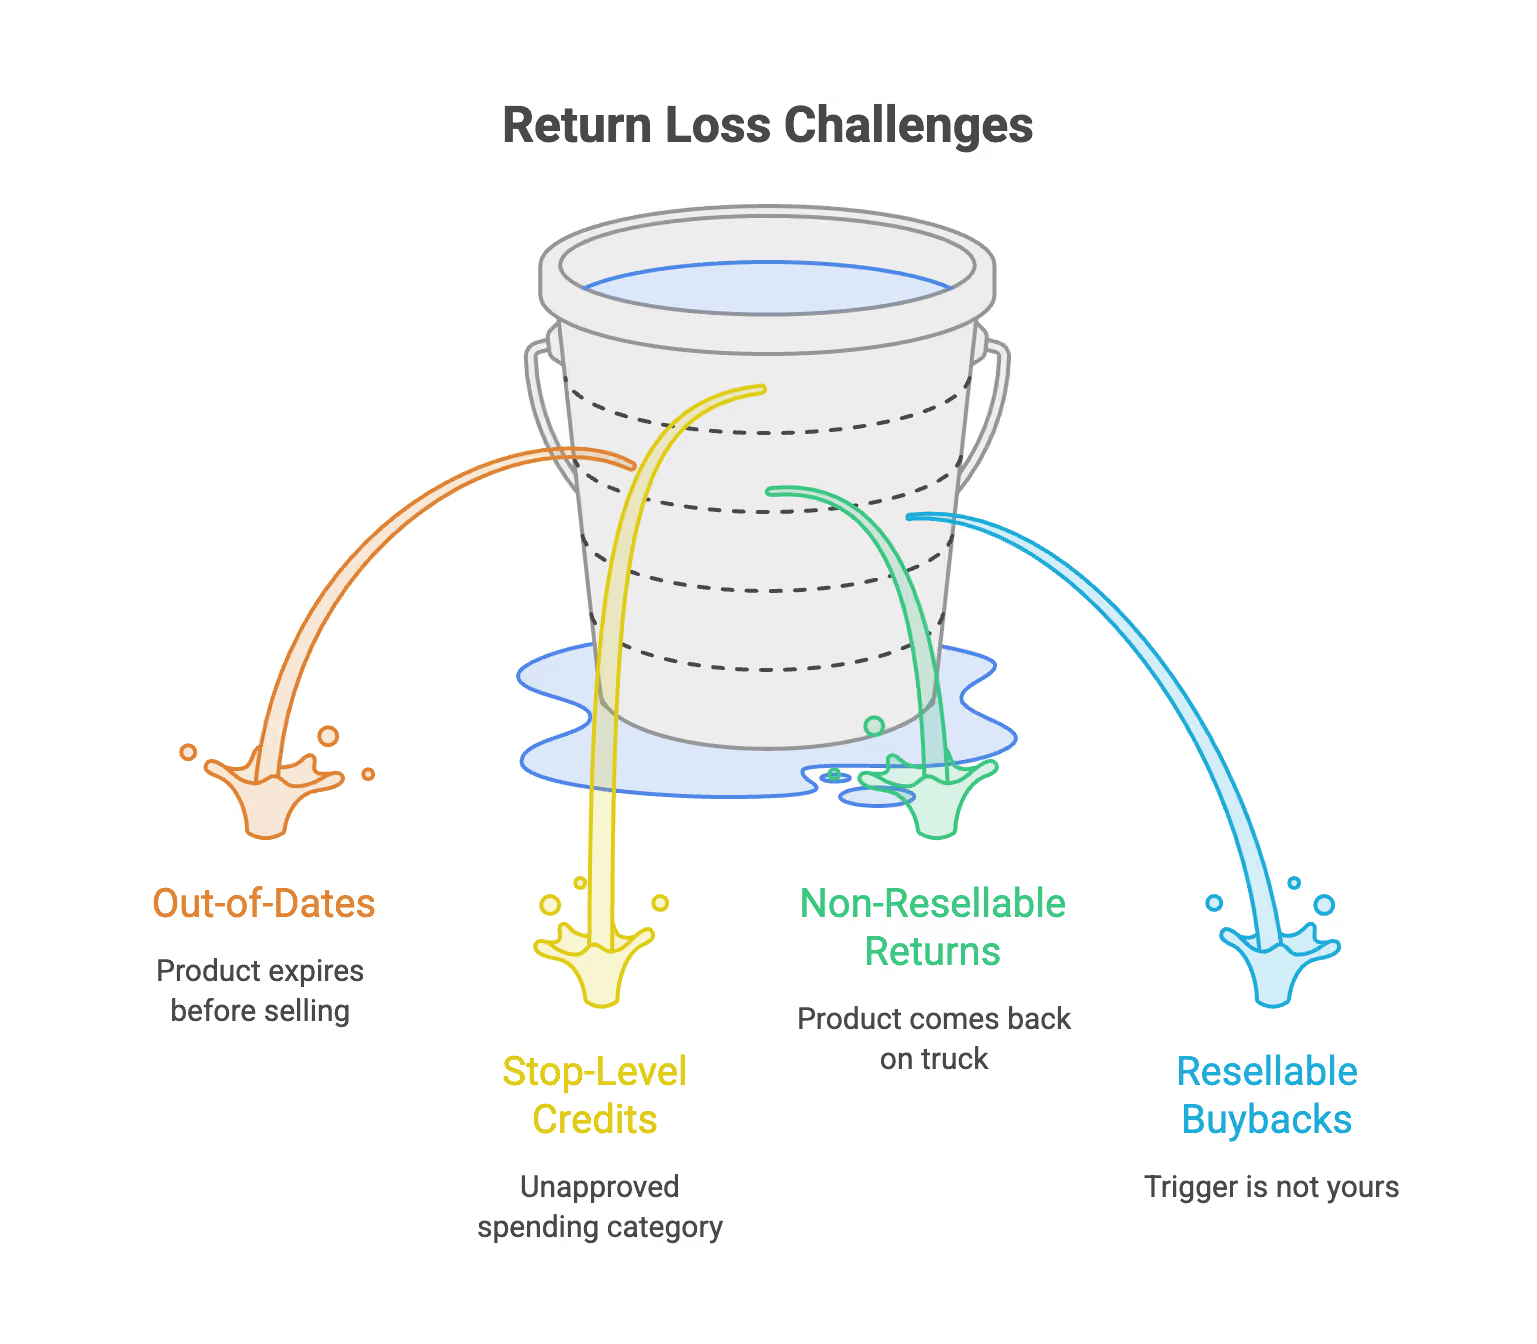
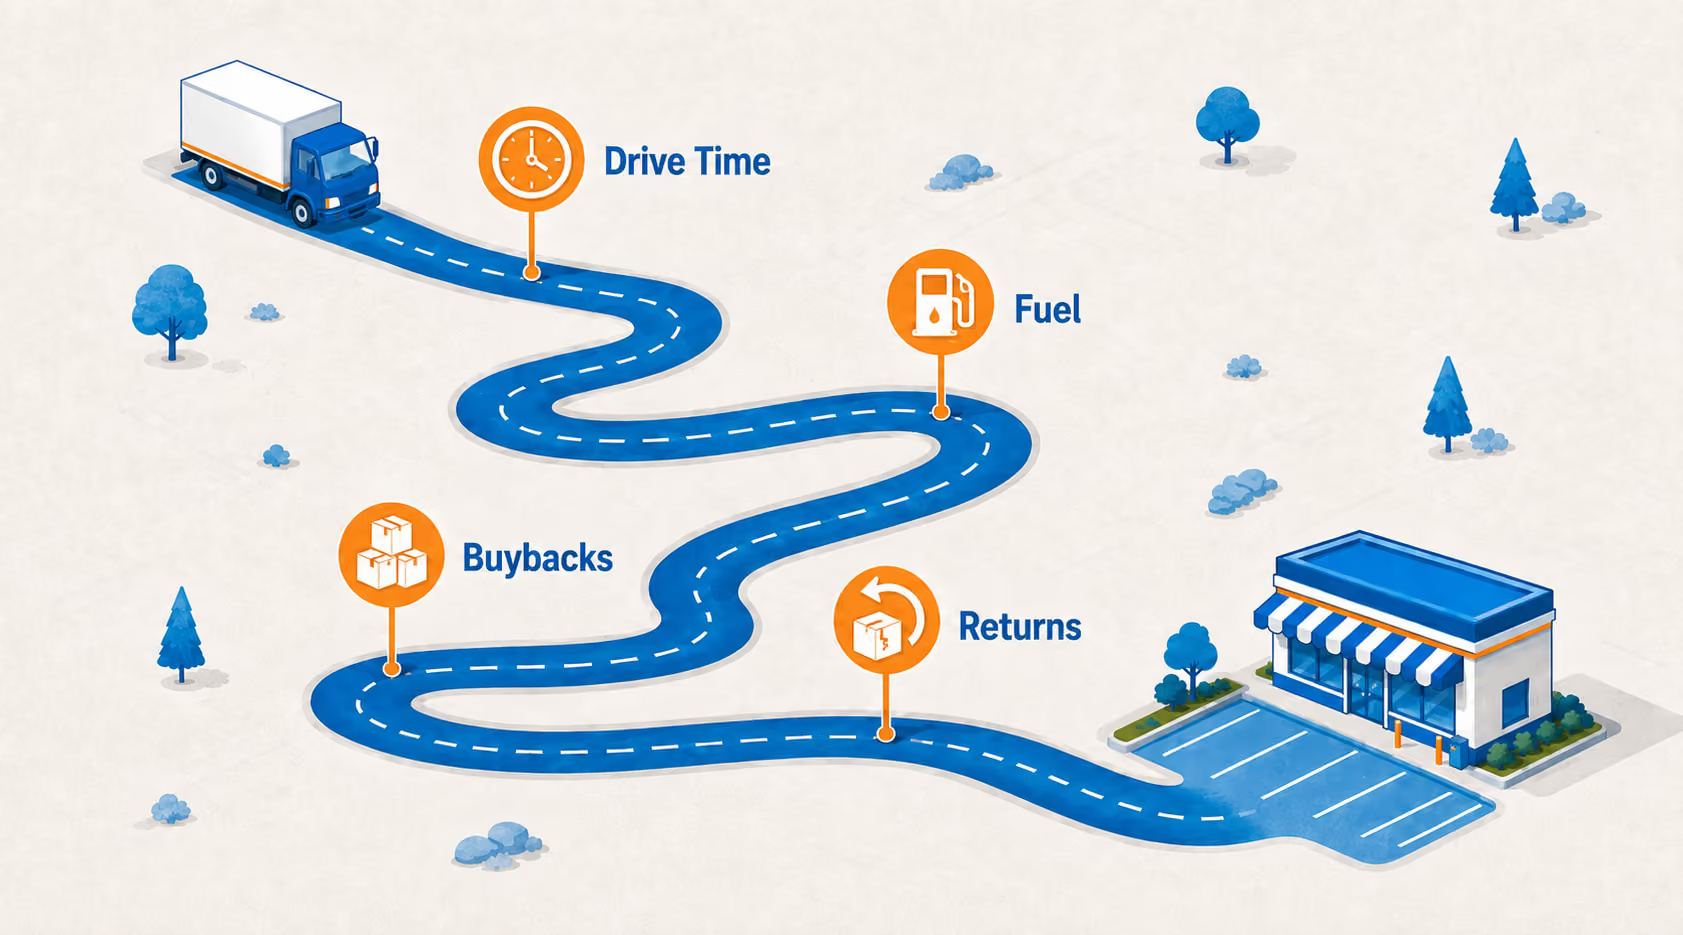
If you ask most operators what returns cost them last month, you’ll usually get a range instead of a clear number. They usually fall into four main categories:
Out-of-dates or stales
This is product that expires before it sells. It’s the first thing most people think of, and in frozen and dairy, it’s the most predictable. You usually know the shelf life and how quickly an account sells through. What’s harder to predict is which accounts always hold onto product a bit too long, and which items keep expiring no matter where you put them.
Stop-level credits and shortages
A case arrives damaged. A store manager says three units were short on the last delivery. A driver writes it up and moves on, because arguing over eleven dollars costs more in time than the money itself. Individually, every one of those calls is correct. Collectively, they're a spending category nobody approved.
Returns (Not Resellable)
This is a product that comes back on the truck for reasons like:
- the store over-ordered
- the display was taken down
- a promotion ended early
- product spoilage
Buybacks (Resellable)
Examples:
- A manufacturer discontinues an item, and you’re left with six weeks’ worth.
- A retailer resets their shelves, and your space drops from four items to two.
- A new product launch doesn’t sell, and all of it comes back at once.
What sets buybacks apart is that the trigger is usually not yours. A discontinuation, a reset, a launch that flops—the decision gets made somewhere else, and the product lands back on your truck regardless of how well you managed the account.
Making the Leak Visible
When losses are spread across lots of small transactions, it’s hard to spot the patterns. Some accounts return more than others. Some products go stale more often. Some routes always have more credits, and it’s usually not by chance.
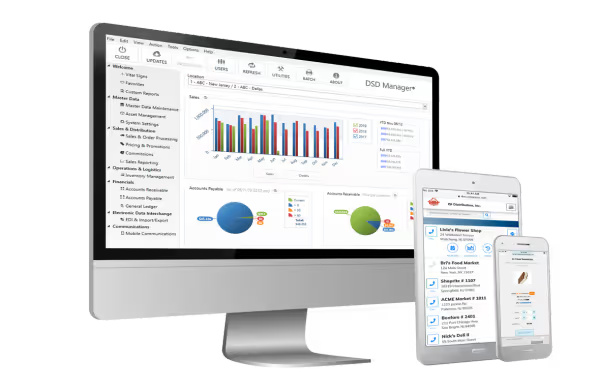
The information is all there. It's just scattered where you can't act on it. That's the gap DSD Manager closes: not by adding steps for your drivers, but by capturing what they're already doing in a form you can use.
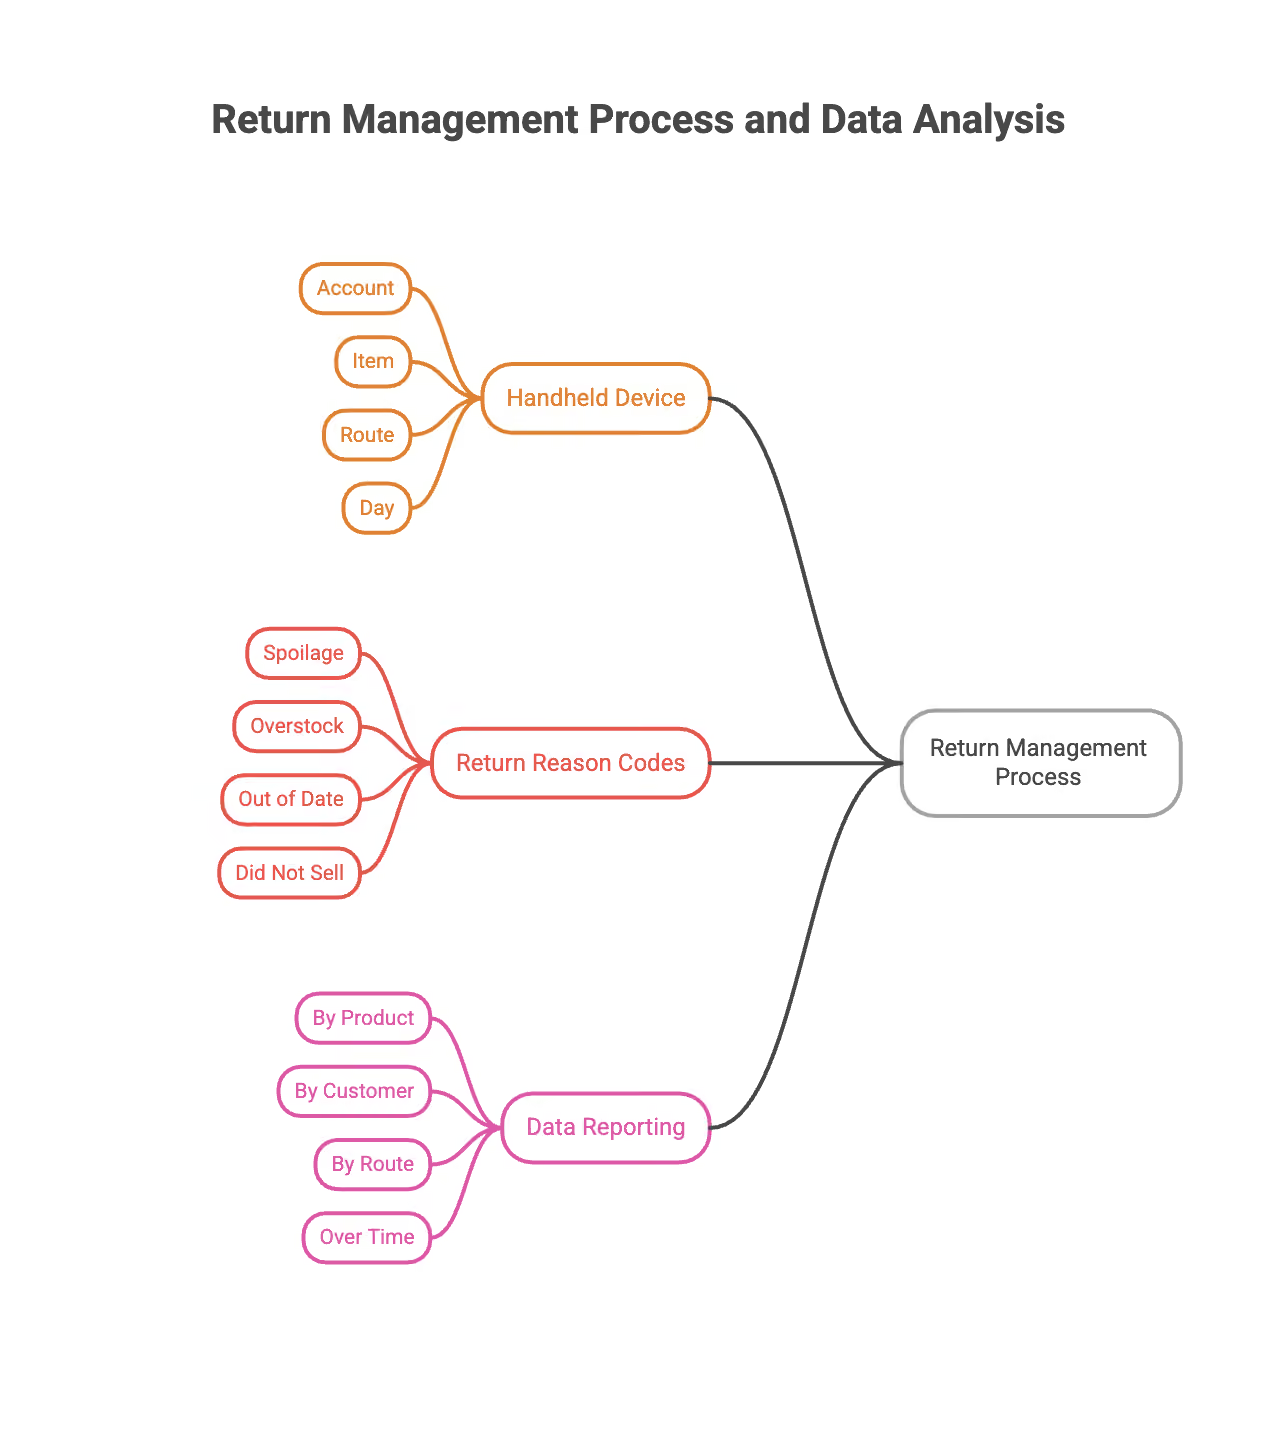
It starts with the handheld device. When a driver processes a return or issues a credit at the stop, it’s recorded right there using a return reason code or a description, linked to the account, the item, the route, and the day.
Every return has a reason attached. DSD Manager uses return reason codes that you set yourself, so they match how your operation describes the problem—spoilage, overstock, out of date, did not sell, or any other categories that fit your business.
Then it becomes reporting you can sort. Once returns and credits are captured with context, you can look at them from whichever angle you need:
- By product: see which items go stale more often, no matter where they’re placed
- By customer: find out which accounts return more than you’d expect based on their volume
- By route: spot where credits pile up, and see if it’s due to the accounts or the service pattern
- Over time: check if a change you made last quarter actually made a difference
Turning the Data Into Fewer Losses
Spotting the pattern is the hard part. Acting on it is mostly about knowing where to begin, and once you have the reports in front of you, the next steps usually become clear.
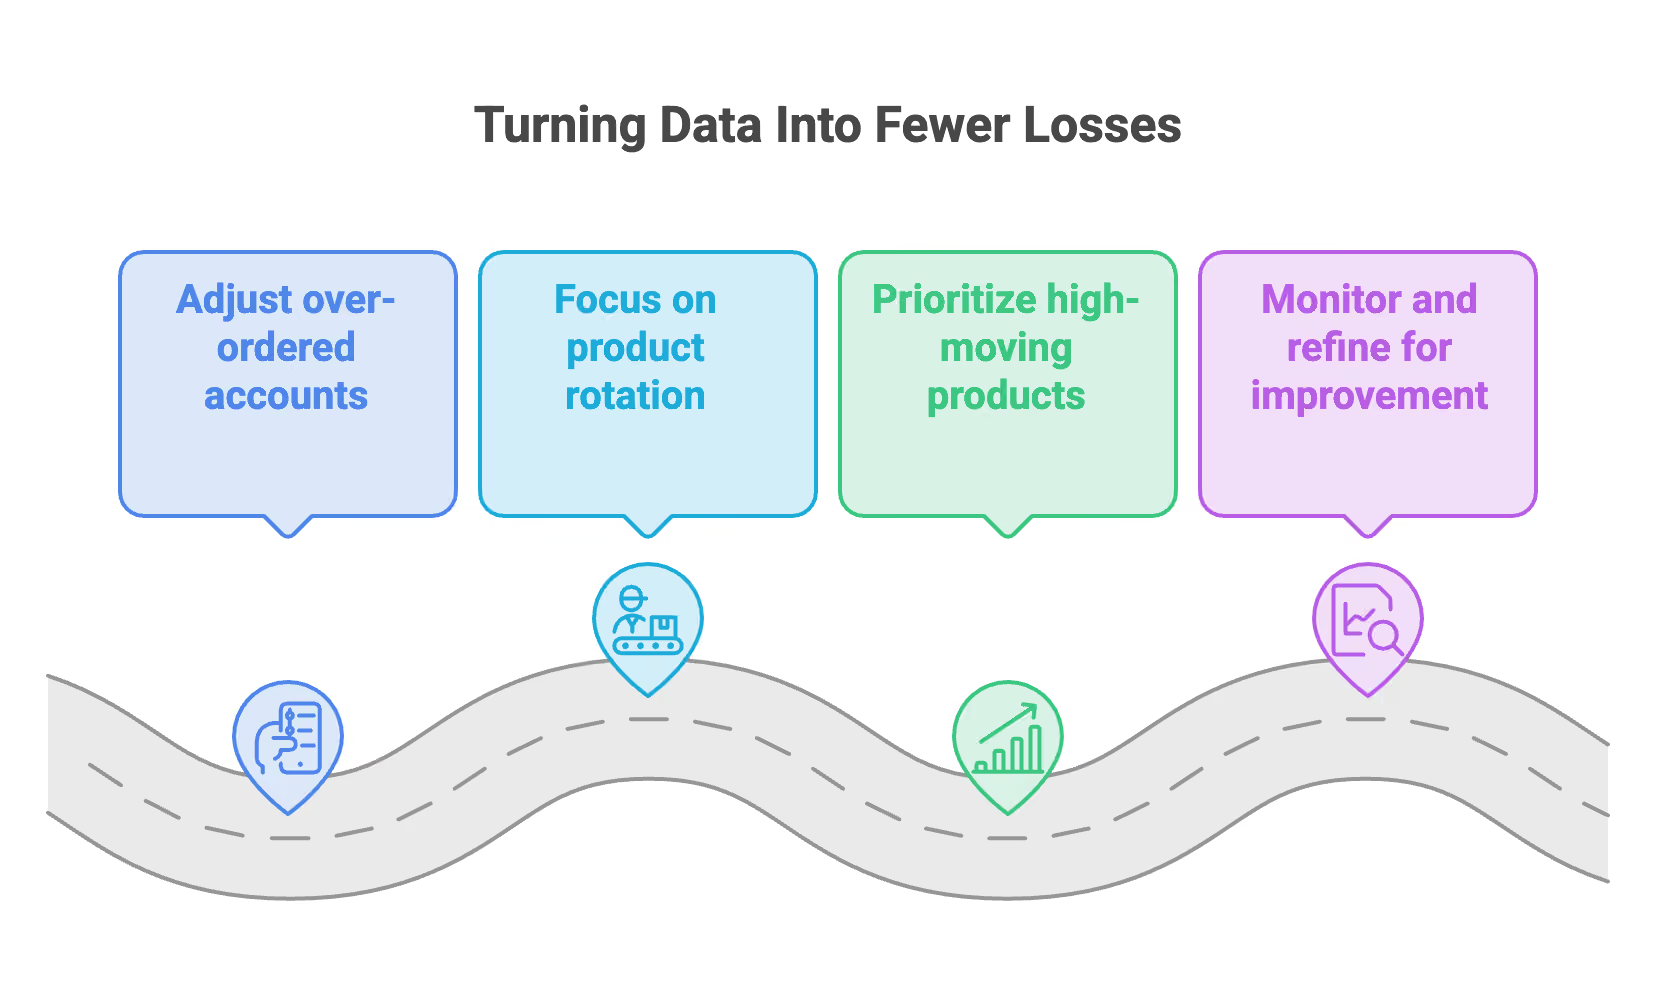
Adjust the accounts that are always over-ordered. If the same 12 accounts show up in your return reports every month, it’s not a service failure—it’s an order quantity that no longer matches reality. Change it, see what happens to both returns and out-of-stocks, and adjust again. The extra cushion you built in three summers ago comes out one account at a time, and the same trend data helps you plan for next August before the product even ships.
Focus on rotation where it really matters. Not every product needs the same level of attention. If your reports show that four items account for most of your expired items, have your warehouse staff check those items to ensure products are shipped with the correct expiration dates to maximize shelf life. Targeted effort works better than a blanket policy that no one can keep up with in August.
Focus on selling what actually moves, not just what’s being pushed. This is where your returns data really pays off. Every manufacturer wants their full line on your truck, but your return reports show which items actually sell at which accounts, and which ones you’ve been carrying and taking back for two seasons. That’s a better way to talk about product mix than relying on a promotional calendar, and you’ll have real numbers to back you up.
This isn’t just a one-time fix. Instead,
- you adjust par levels, and next month’s report shows if they worked
- you tighten rotation on your worst offenders and monitor expiration dates
- returns stop being the end of the story and become a decision–making tool.
Each round becomes an opportunity for improvement.
Conclusion
Think back to that driver at the freezer door in the first week of August. He’ll still have to pull expired product from the shelf sometimes. That’s not a failure. It’s part of keeping accounts stocked during the busiest weeks.
What matters is what happens next:
- The credit is captured with a reason instead of written on paper and filed away.
- The item appears alongside the eleven other times it came back from slow-turning accounts.
- Someone reviews the pattern and adjusts the order, removes the item, or raises the issue with the manufacturer.
The driver’s day stays largely the same. The decisions made afterward get better, and so does your margin.
We built DSD Manager to close that gap. After three decades in this industry, it’s one we see often: distributors and manufacturers rarely lack hustle. What they lack is a clear line between what happens at the stop and what gets decided in the office.
Streamline Your DSD


.avif)
All Rights Reserved.